How quant traders expect to make profits.
In my last post I said that quants use market data to power a research process that determines whether their ideas are right or wrong over time. When they reach a satisfactory result (in this context satisfactory is intended in mathematical sense), they implement a strategy in a quant system.
The use of a rigorous methods in this research process represents the first very big difference between the traditional way of making trade and quant trading. Indeed, the goal is to keep out the emotional component from the decision-making process at the base of trading and investments, and imposes a solid discipline based on ideas that have been tested and verified thoroughly.
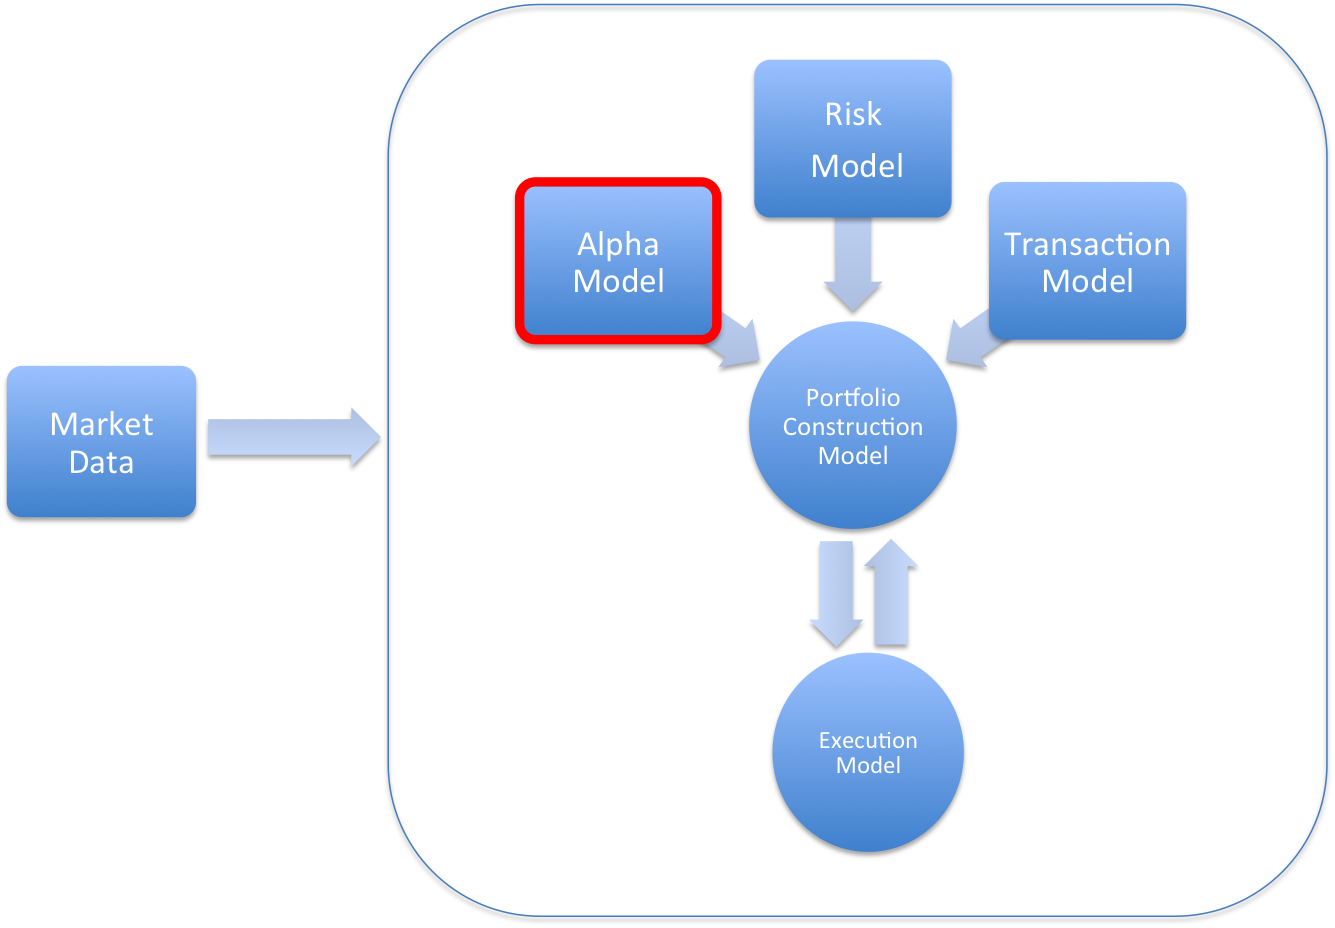
This post is focused on the alpha model, the first component of a quant system and where the most part of research is focused. Alpha strategies are designed to determine the composition and quantity of the portfolio. Indeed, the output from alpha model is either a return forecast or direction forecast.

######Black Box structure, credits ‘Inside The Black Box’ by Rishi Narrang
There are several interpretations in Finance about the meaning of alpha. In an easy way, it can be considered the *portion of return from investments that is not derived from benchmark of the market, but by the ability of investors.
Alpha models can consider a wide range of financial instruments. However, generally they are not interested in instruments that are worth little because they do not generate a return. On the contrary they are interested in finding and buying stocks that are undervalued and selling when they exceed the price.
There are two broad categories of alpha models:
-
theory driven: they start with the observations of the market, and from these observations they generalize theories that can explain what has been observed, and then test these theories on the field.
-
data driven: the assumption is that empirical observations of the market and data analysis can obviate theories. They *seek recognizable patter within data market**, which can be detected automatically and reliably.
Theory driven alpha models
The major part of alpha models are currently theory driver. Starting from a feasible explanation of the market, the principal step is to develop a theory that explain why the market behaves in a certain way. Finally, the theory is tested to see if it can be used to predict the future with success.
####Price related data strategies
The inputs of a strategy are essential to understanding the strategy itself. The first type are called Price related data strategies. In this case the information coming directly from the Exchange (e.g. price, traded volumes), and are characterized from the way to predict the future price of a financial instrument.
Basically there are two options:
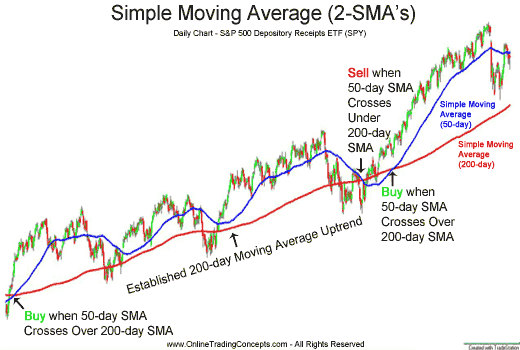
- price continues to move in the same direction. It is called Trend Following or Momentum. These strategies are based on the idea that the market often moves for a long time in a certain direction, and it is possible to identify and ride this direction to make gains. This is what is called a trend. In Economics, a trend means that there is a widely consensus among the investors. Some people, however, argue that trends can born thank to the Theory of the craziest. This theory says *because of people believe in the trend, they begin to buy instruments that have a growing price and to sell all instruments that are showing a decreasing price. This behavior implicitly creates a trend but is a sort of false positive. Of course, much depends on the ability of traders to look at the significant trends and discard false positives. A very famous Trend Following technique is called Moving Average Crossover. It consists in comparing two indexes: a short term (50 day) and long term (200 day) index. The golden rule is quite simple: sell if the short term index is below the long term index, buy if it is upper.

######Moving Average Crossovers (credits http://www.onlinetradingconcepts.com)
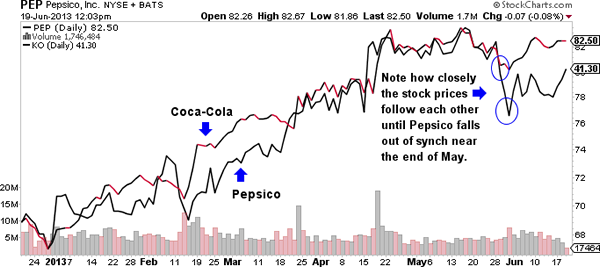
- price goes in the opposite direction. It is called Mean Reversion. The theory behind these inversion strategies is that exist a center of gravity around which prices fluctuate, and it is possible to identify both the center of gravity and fluctuations to understand that there is a trend. Statistical arbitrage is one of the most used mean-reversion strategies, betting on the convergence of prices of similar actions when they have prices that diverge.

######Statistical arbitrage (credits http://www.nasdaq.com)
Trend Following and Mean Reversion work very well and are widely used, but they have a different time horizont. Indeed the former have long time horizon while the latter is used in case of short time horizon.
####Fundamental Data strategies
The second type of strategies are those based on Fundamental Data: in few words, they looking for patterns in market data.
- Value/Yield: they are associated with equity trading. There are so many metrics used:
- price-to-earning ratio (P/E)
- earning-to-price (E/P)
- Growth: this strategy seeks to make predictions on asset based on historical observations about the level of economic growth. The basis idea of this theory is that it is better to buy assets that are having a fast-growing and/or selling assets that are experiencing a decline in their market.
- Price/Earnings to growt (PEG)
- Gross domestic product (GDP)
- Quality: a quality investor believes that it is better owning high quality instruments, and selling or possessing for a short time low quality instruments. In general, a strategy to own high quality products helps to protect investors, particularly in a stressful market situation.
Data driven alpha models
These strategies are much less widely used. The reasons are that they are rather difficult to understand and the underlying mathematics is quite complicated. Indeed, is very common that these strategies include Machine Learning, like Data Mining or Neural Networks.
The inputs of these models coming from the Exchange (e.g. prices, traded volumes).
Although a data driven strategy requires a strong mathematical background, there are some advantages in implementing it:
-
they are difficult to implement than theory driven strategies, therefore there are fewer competitors outside,
-
they allow to find out what is happening in the market without knowing why it is happening.
###Implementations
####Forecast Target A foundamental step is to determine what the model should forecast: direction, amplitude, duration of a market movement. In general, the strategies seek to predict the direction, which means if the price goes up or down, and nothing more. It is worth nothing that also the intensity (strength) of the signal within the model is foundamental to make good predictions.
####Time Horizon Some models predict in a range of microseconds, while others even years. Is not unusual to see that the same strategy applied on different time scales can lead to conflicting results. In High-frequency trading (HFT), for instance, the predictions generally do not go beyond the end of the day. There are three classes of predictions:
- short-term: 1 to 20 days;
- medium-term: from two weeks to few months:
- long-term: different months or even years.
####Summary In this post I talked about the alpha model. An alpha can be considered as the type of exposure from which a quant trader expected profits. The exposure to risks not only generates a lot of profit in the long run, but can impact the strategy day by day. In the next post I will talk about the Risk Model, the second component inside the Black Box structure.
###Further Information
Inside the Black Box: The Simple Truth About Quantitative Trading by Rishi K. Narang
Statistical Arbitrage, Wikipedia
Moving Average Crossover, Wikipedia
High Frequency Trading, Wikipedia